Graphing Proportional Relationships
Free printable graphing proportional relationships worksheets. Is the line proportional? Find k, write y = kx, read y past the graph. With answer key.
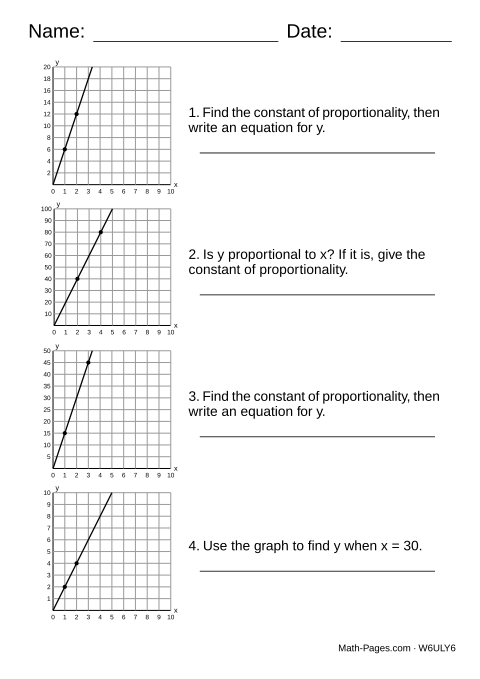
Every question is a graph: a straight line on a grid with two of its points dotted. Some ask whether y is proportional to x and, if it is, for the constant of proportionality; some ask for the constant and an equation, like y = 4x; and some ask for y at an x far off the edge of the graph, like x = 25.
A graph shows a proportional relationship when it is a straight line through the origin, (0, 0). A line that misses the origin is still straight, so it looks right, but it is not proportional: y = 2x + 4 starts at 4, not 0, and its ratios change. The y axis counts in steps of 1, 2, 4, 5 or 10 a gridline, so read its numbers before dividing.
Each page deals the three questions evenly, and splits its yes and no graphs as evenly as the count allows, so neither answer is a safe guess. The constant is a whole number from 2 to 30, and the lines that are not proportional cross an axis at least two gridlines from the origin, so they are easy to see.
What this worksheet covers
- Decide whether a graph shows a proportional relationship
- Find the constant of proportionality from a graph
- Use y = kx to find a value past the edge of the graph
Common Core standards
- 7.RP.A.2a Decide whether two quantities are in a proportional relationship by testing for equivalent ratios in a table.
- 7.RP.A.2b Identify the constant of proportionality (unit rate) in tables.
- 7.RP.A.2c Represent proportional relationships by equations.
Frequently asked questions
How can you tell from a graph that a relationship is proportional?
The graph is a straight line that passes through the origin, (0, 0). A straight line that crosses the y axis above 0, like y = 3x + 6, is not proportional, because when x is 0 it has already started at y = 6.
How do you find the constant of proportionality from a graph?
Pick a dotted point, read its x and y, and divide y by x. If the dot is at x = 4 and y = 20, then k = 20 ÷ 4 = 5 and the equation is y = 5x. Look at the numbers on the y axis first: on a graph that counts in 5s, the fourth gridline up is 20, not 4.
How do you find y when x is past the edge of the graph?
The graph stops at x = 10, so read k from a dotted point, then multiply. If the dot at x = 2 is at y = 10, then k = 10 ÷ 2 = 5, and when x = 25, y = 5 × 25 = 125.
Why does the y axis count by 5s or 10s on some graphs?
A steep line such as y = 20x would run off the top of the grid before x = 1 if each gridline were worth 1, so the axis counts in bigger steps. With each gridline worth 10, the grid goes up to 100 and y = 20x leaves the top at x = 5.
What grade are graphs of proportional relationships?
Seventh grade, standard 7.RP.A.2. These sheets read a line that is already drawn: whether it is proportional, its constant, and values past its edge. Drawing the graph, and explaining what a point means, are not on them.