Bar Graph Worksheets
Free printable bar graph worksheets: two charts per sheet, three questions about each. Read, compare and add up a drawn bar chart, with an answer key.
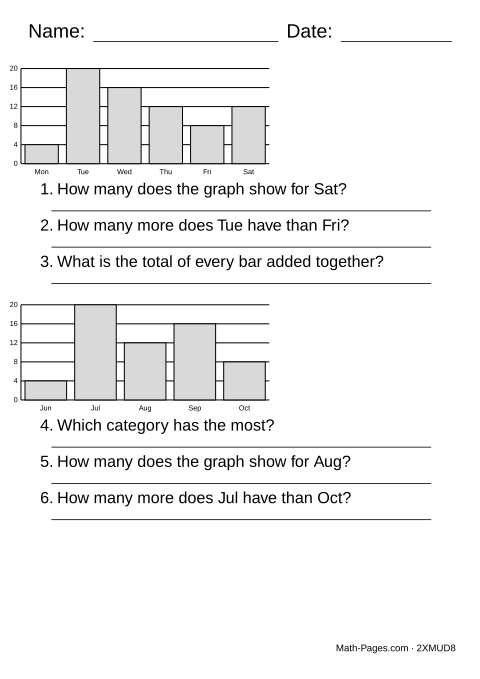
Each sheet draws two single-series bar charts - months, days, colours, fruit or sports along the bottom, four to six bars tall - and asks three questions about each one, the way a real bar-graph worksheet does. That is the point of the page: a student reads one chart several times over, comparing two categories on it and then adding up the whole thing, instead of meeting a brand-new chart for every question.
The three questions about a chart never ask the same thing twice. One asks how many for a single category, one asks how many more one category has than another, one asks for the total of every bar or which category has the most - so three of the four kinds are ordinary addition and subtraction with the numbers read off a picture instead of written down, and only reading a single bar is pure reading.
Every bar ends exactly on a labelled gridline, never between two of them. A bar a student had to estimate would have no single right answer, so every value on this sheet is drawn to land precisely on a line the chart already shows the value of.
What this worksheet covers
- Read values from a bar graph
- Answer comparing and totaling questions using the graph
Common Core standards
- 2.MD.D.10 Draw picture and bar graphs and solve simple problems using a bar graph.
- 3.MD.B.3 Draw scaled bar graphs and solve "how many more" and "how many less" problems with them.
Frequently asked questions
How do you read a bar graph?
Find the bar for the category you want, follow its top across to the scale on the left, and read off the number the gridline there is labelled with.
Why do several questions share one chart?
Because that is what reading a graph actually involves. A sheet that drew a fresh chart for every question would never ask a student to compare two values on the same one, or to add a chart up after having already read a bar off it - and comparing within one chart is the skill the topic is about. You can set two, three or four questions per chart.
Why does every bar line up exactly with a gridline?
So there is only one correct reading. A bar that stopped between two gridlines would leave a student guessing whether the answer is the lower value, the higher one, or something in between - and a key can only print one of them.
Are these worksheets in colour?
No - the bars print in grey with a black outline, on purpose. A worksheet is printed in black and white far more often than not, and a chart that only makes sense in colour fails the moment it comes out of a black-and-white printer.
What grade level reads bar graphs?
Second and third grade (2.MD.D.10, 3.MD.B.3) introduce reading and comparing a bar graph; by third grade, students are also expected to solve one- and two-step problems using the data it shows.