Histogram Worksheets
Free printable histogram worksheets: read how many values fall in each interval, add intervals together and find the total, with an answer key.
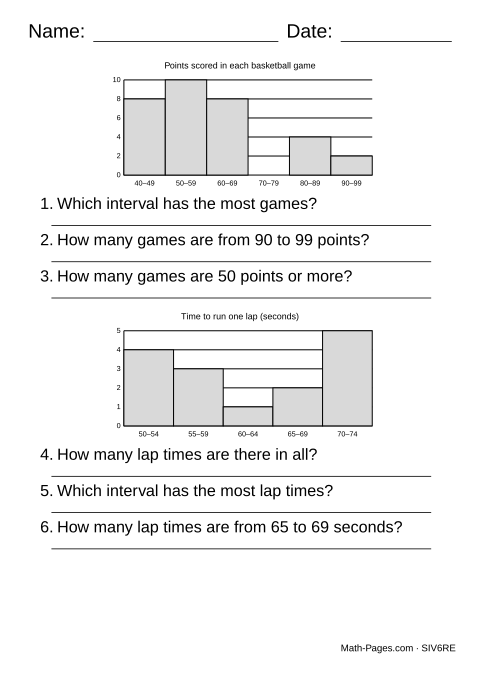
Each sheet draws two histograms, with three questions about each. A histogram is a bar graph for numbers: each bar covers an interval, such as test scores from 70 to 79, and its height is how many values fall in that interval. The bars touch, because the intervals do.
Every bar is labelled with its interval in whole numbers, 70–79 rather than a tick at 70 and another at 80, so no value could belong to two bars, and every bar ends on a gridline. The questions ask how many values are in one interval, in several intervals together (such as 80 or more), in the whole data set, and which interval has the most.
No question asks for a single value, such as the highest score or the median, because a histogram doesn't show single values: scores of 71 and 78 look the same in the 70–79 bar. That is the difference between a histogram and a dot plot.
What this worksheet covers
- Read how many values fall in an interval from a histogram
- Combine intervals to answer "or more" questions
- Find the number of observations in a data set shown as a histogram
Common Core standards
- 6.SP.B.5a Summarize numerical data sets in relation to their context, such as by reporting the number of observations.
Frequently asked questions
What is the difference between a histogram and a bar graph?
A bar graph's bars stand for categories, such as kinds of fruit, and are drawn apart. A histogram's bars stand for intervals of numbers, such as heights from 120 to 124 centimetres, and touch, because one interval runs into the next. A bar graph's bars can be put in any order without changing what it says; a histogram's cannot.
Can you find the median from a histogram?
Not exactly. A histogram shows how many values fall in each interval, not the values themselves, so the median can only be placed in an interval. If 25 students took a test, the median is the 13th score, and counting up the bars from the lowest interval shows which bar holds it, but not what it is. These sheets ask only what a histogram shows exactly.
How do you answer an "or more" question?
Add the bars for every interval at or above the number. If the bars for 80–89 and 90–99 are 6 and 3, then 9 students scored 80 or more. The questions always start at the bottom of an interval, so the answer is whole bars and never part of one.
Why does every interval have the same width?
So the heights can be compared directly. With equal widths, a taller bar always means more values. Histograms with unequal intervals exist, but reading them needs the area of each bar rather than its height, which is beyond sixth grade.