Reading Bar Graphs Worksheets
Free printable reading bar graphs worksheets. Each problem draws a chart and asks the value of one bar, with an answer key. No arithmetic required.
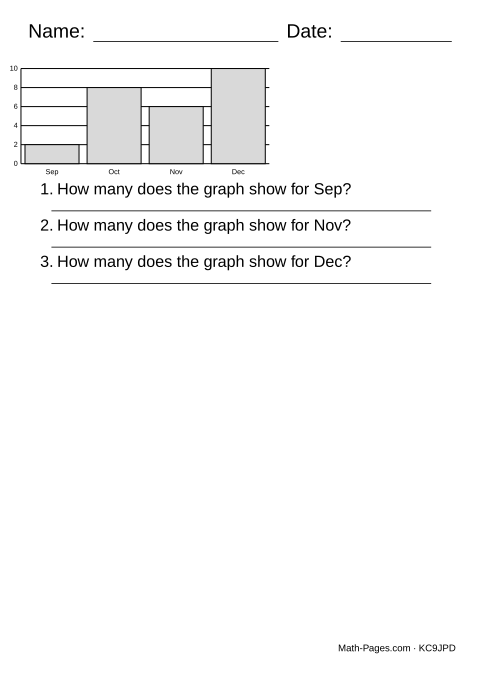
One single-series bar chart, and three questions asking for the value of a named bar on it - no adding, no subtracting, just finding the right bar and reading the scale. Reading the same chart three times over is the point: it is the skill underneath every other bar-graph question, and the one worth practising on its own before mixing in the arithmetic our full bar graph worksheet adds.
Each of the three questions names a different category, so none of them can be answered by remembering the last one. The scale is smaller here than on the mixed page - a top gridline of 10 rather than 20 - so the numbers stay simple while the reading itself is what is new. Every bar still ends exactly on a labelled gridline, so the answer is never a judgement call between two lines.
What this worksheet covers
- Read the value of a bar against the scale
- Find a named category on a bar graph
Common Core standards
- 2.MD.D.10 Draw picture and bar graphs and solve simple problems using a bar graph.
Frequently asked questions
How do you read the value of one bar on a graph?
Find the bar for the category named in the question, trace the top of it straight across to the scale on the left, and read the number next to the gridline it lines up with.
Why is there no adding or subtracting on this page?
Reading a chart is its own skill, separate from doing arithmetic with what it shows. This page isolates it; our full bar graph worksheet mixes in the totals, differences and "which is largest" questions once reading is solid.
Why is the scale smaller than on other bar graph worksheets?
A top gridline of 10 keeps every value small and every gridline easy to count up to, so a student who is still learning to read a chart is not also fighting with big numbers.
What grade level is reading a bar graph?
Second grade (2.MD.D.10) is the standard introduction to reading a single-series bar graph, ahead of the comparison and total questions third grade adds.