Line Plot Worksheets
Free printable line plot worksheets: two plots of whole-number data a sheet, four questions about each. Count, compare and total X's, with an answer key.
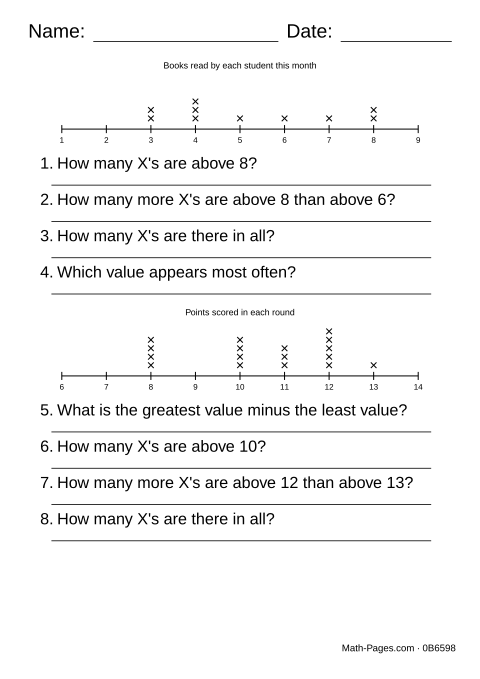
Each sheet draws two line plots. A line plot is a number line with an X above a value for every time that value appears in the data: books read, goals scored, letters in a name, points in a round, push-ups. The line runs nine whole numbers, every one of them labelled, and four questions follow each plot.
The questions are the ones a line plot is for: how many X's are above one value, how many more are above one value than another, how many there are in all, which value appears most often, and the greatest value minus the least. Every sheet asks all five kinds, and no plot asks the same question twice.
Every X sits exactly on a tick, so a value is read, never estimated. Only one value is ever the most common, so that question has one answer. The two ends of the line are always empty, so the greatest and least values come from the X's and not from the first and last labels on the line.
What this worksheet covers
- Read how many times a value appears on a line plot
- Compare and total the data shown on a line plot
- Find the greatest value minus the least value
Frequently asked questions
What is a line plot?
A number line with a mark, usually an X, above a value once for each time that value appears in a set of data. Counting the X's above a number tells you how many times it came up, and the tallest stack is the most common value.
How do you find the greatest value minus the least value on a line plot?
Find the X farthest to the right and the X farthest to the left, read the number under each, and subtract. Only values with an X above them are data; an empty tick at either end of the line is not.
What grade learns line plots?
Second grade puts measurements in whole units on a line plot, third grade adds halves and quarters, and fourth and fifth grade use eighths and solve fraction problems with the data. These sheets ask students to read a line plot rather than draw one.
Can the line show fractions instead of whole numbers?
Yes. Set the line to halves, quarters or eighths in the settings, or open Line Plots with Fractions, which starts on quarters and explains how the fraction labels are written.