Box Plot Worksheets
Free printable box plot worksheets: read the median, quartiles, range and interquartile range from box-and-whisker plots, with an answer key.
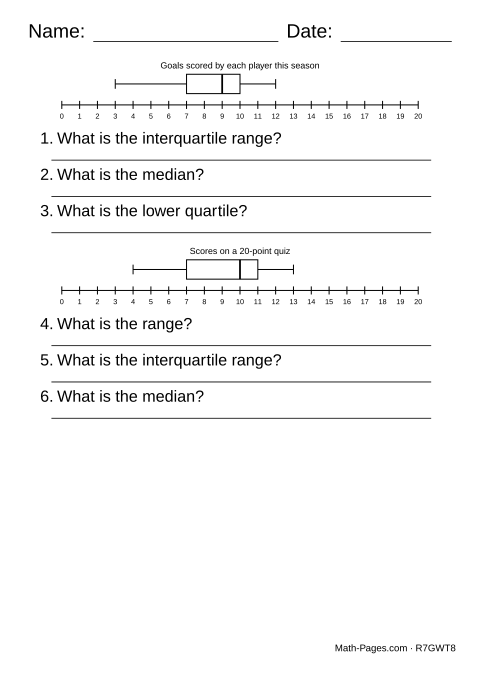
Each question reads a box plot drawn over a number line. The whiskers run from the smallest value to the largest, the box from the lower quartile to the upper quartile, and the line inside the box is the median. Three questions go with each plot.
Every one of the five numbers lands on a labelled tick, so each is read straight off the line, never estimated. The questions ask for the median, a quartile, the range (largest minus smallest) and the interquartile range (upper quartile minus lower quartile).
The plots are read, not made. Making a box plot from a list means finding quartiles, and textbooks and calculators don't all find them the same way, so one list can have two right answers. Reading a drawn plot has only one.
What this worksheet covers
- Read the median and quartiles from a box plot
- Find the range and interquartile range of a data set shown as a box plot
Common Core standards
- 6.SP.B.5c Summarize a data set with measures of center, such as the mean and median.
Frequently asked questions
What does each part of a box plot show?
The five marks are the five-number summary: the minimum, the lower quartile, the median, the upper quartile and the maximum. About a quarter of the data lies in each of the four sections between them, so a long whisker means the values in that quarter are spread out, not that there are more of them.
How do you find the interquartile range?
Subtract the lower quartile from the upper quartile, the two ends of the box. If the box runs from 14 to 26, the interquartile range is 26 - 14 = 12. It measures the spread of the middle half of the data, so unlike the range it isn't stretched by one unusually large or small value.
Why do different books get different quartiles?
There are several rules for the quartiles of a list. Some leave the median out when splitting the list in half, some keep it in, and some calculators average between values. For the list 1, 2, 4, 6, 7, 9, 10, leaving the median out gives a lower quartile of 2; keeping it in gives 3. Reading a drawn box plot avoids the question, which is why these sheets don't ask for a plot to be made.
Is the median always in the middle of the box?
No. The median sits wherever the middle value is. When the values between the median and the upper quartile are bunched together, the median sits close to the right end of the box. On these sheets the median is never exactly in the middle, so it can't be found by halving the box.