Dot Plot Worksheets
Free printable dot plot worksheets: find the median, mode and range from two dot plots of whole-number data a sheet, with an answer key.
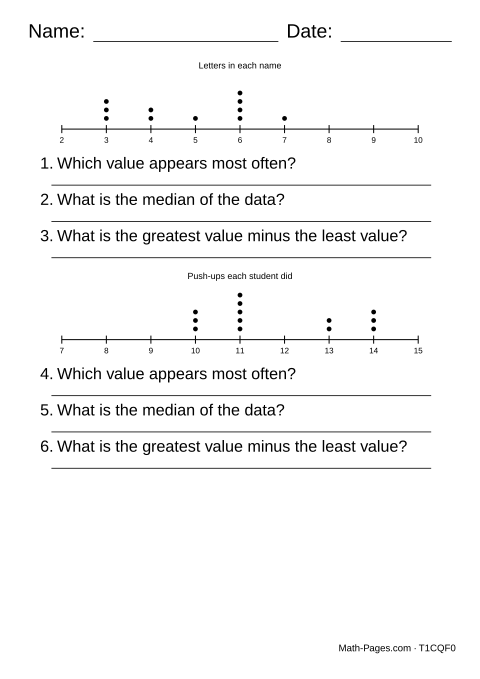
Each sheet draws two dot plots of whole-number data, such as books read, goals scored or points in a round, with a dot above a value for each time it appears. Three questions follow each plot: the value that appears most often, the median, and the greatest value minus the least.
The median is always a single dot's value. Every plot holds an odd number of dots, so there is one middle dot and never two to average: count in dot by dot from either end until you reach it. Exactly one value has the tallest column of dots, so the mode has one answer too.
Every dot sits on a labelled tick. The two ends of the line are always empty, so the greatest and least values come from the dots, not from the first and last numbers on the line. If your class calls these line plots, switch the marks to X's in the settings.
What this worksheet covers
- Find the median, mode and range from a dot plot
- Read whole-number data shown as a dot plot
Common Core standards
- 6.SP.B.5c Summarize a data set with measures of center, such as the mean and median.
Frequently asked questions
What is the difference between a dot plot and a line plot?
Only the name and, usually, the mark. Line plot is the name used from second to fifth grade, often drawn with X's; dot plot is the sixth-grade name, drawn with dots. Both put one mark above a value for each time it appears.
How do you find the median on a dot plot?
Count the dots, add one and halve the total to find the middle position: with 15 dots it is the 8th. Then count dots from the left, column by column, until you reach that one, and read the value under it.
How do you find the mode and range on a dot plot?
The mode is the value with the tallest column of dots. The range is the greatest value that has a dot minus the least value that has a dot; empty ticks at the ends of the line do not count.
Is there a mean question?
No. The mean of a dot plot's data is rarely a value on the line, so it is a different exercise. Mean Worksheets asks for it from a list of numbers instead.