Finding Slope from a Graph
Free printable slope worksheets: count the rise and run between two marked points on a graphed line, positive and negative slopes, with an answer key.
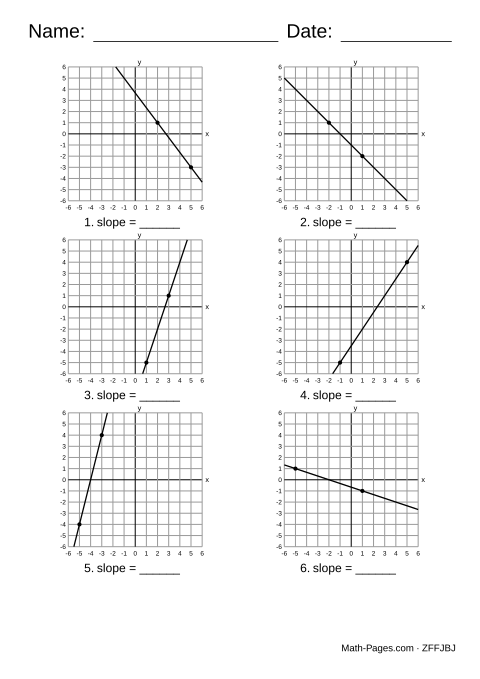
Each question draws a line on a four-quadrant grid with two points marked on it, and asks for its slope. Count the rise, the change in y from one point to the other, and the run, the change in x, then divide: a line that rises 2 while it runs 3 has a slope of 2/3.
Half the lines go up from left to right, with a positive slope, and half go down, with a negative one. Half the slopes are whole numbers and half are fractions such as 3/2 or -1/4. Both marked points sit on grid crossings, so the rise and run are counted exactly, and the answer key gives each slope in lowest terms.
What this worksheet covers
- Find the slope of a line from its graph
- Tell a positive slope from a negative slope
Common Core standards
- 8.F.B.4 Determine the rate of change of a linear function from two (x, y) values or from a graph.
Frequently asked questions
What is slope?
How steep a line is, and which way it goes: the rise divided by the run between any two points on it. A slope of 2 means the line goes up 2 for every 1 across; a slope of -1/2 means it goes down 1 for every 2 across.
How can you tell if a slope is negative?
Read the line from left to right. If it goes down, the slope is negative; if it goes up, it is positive. For a falling line the rise is counted downwards, so it becomes the negative number on top of the fraction.
Does it matter which two points you use?
No. Any two points on a straight line give the same slope, which is what makes it straight. The sheet marks two points on grid crossings so that the rise and the run can be counted exactly; two points further apart give a fraction that simplifies to the same answer, such as 4/6 for 2/3.
What grade is slope?
Eighth grade, where slope is the rate of change of a linear function. It builds on the constant of proportionality from seventh grade, which is the slope of a line through the origin.